
Philadelphia subway map
All three lines and every one of the 70 stations on one drawing, with a vector PDF to download
The map of the network
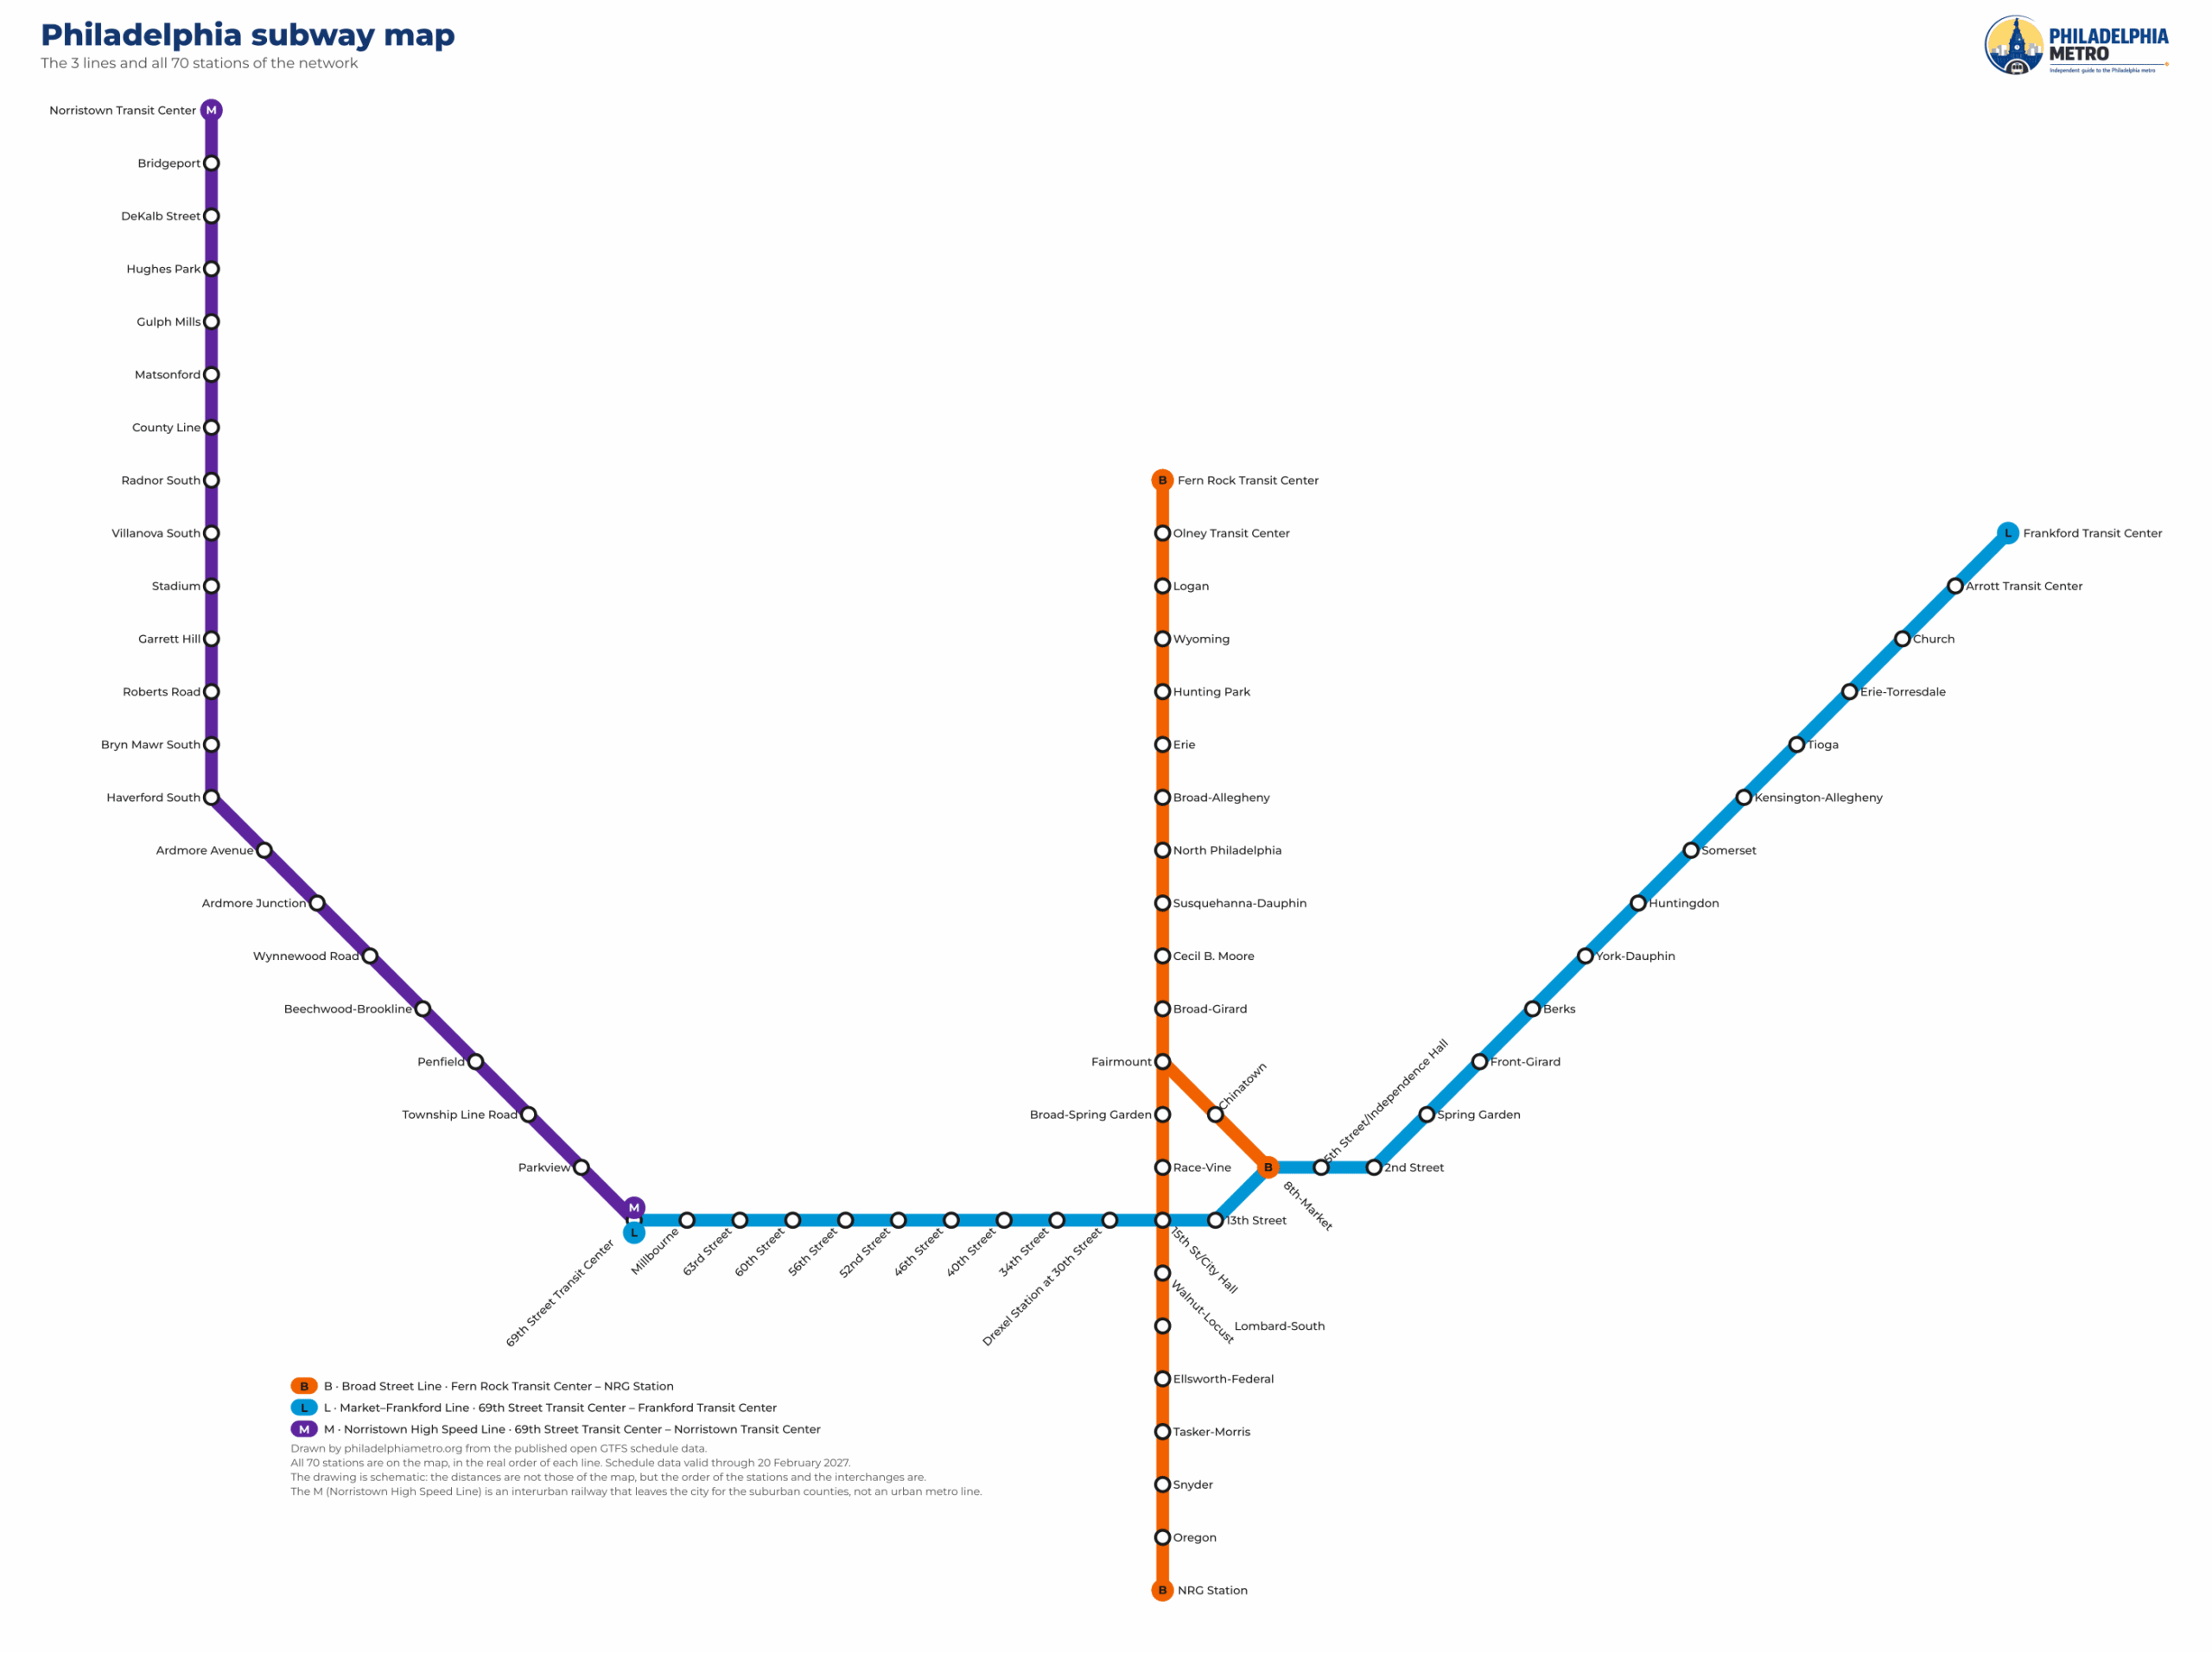
The subway map as a PDF
Vector, so it stays sharp at any size and prints clean on A3. About 103 KB.
The three lines on the map
End points, station count, length and how many service patterns run on each line.
| Line | End to end | Stations | Length | Patterns | |
|---|---|---|---|---|---|
| B | Broad Street Line | Fern Rock Transit Center → NRG Station | 24 | 10.36 mi (16.68 km) | 3 |
| L | Market–Frankford Line | 69th Street Transit Center → Frankford Transit Center | 27 | 13.16 mi (21.17 km) | 1 |
| M | Norristown High Speed Line | 69th Street Transit Center → Norristown Transit Center | 22 | 13.4 mi (21.56 km) | 1 |
The colours are not a design choice: each one is the colour the schedule data publishes for that line, which is also the colour on the platform signs. The patterns column is the part a map cannot really show — the B has three of them, and a single orange line on a diagram looks like one train calling everywhere. It is not. The B line page has the three sets of stops side by side.
Every station, line by line
In order, terminus to terminus. The gold ring marks the three stations where you can change lines — in all three you change platform. Click any station for its times, its access and what is around it.
Stop on this lineEnd of the lineTransfer, different platform
Fern Rock Transit Center → NRG Station
22 stations · 10.36 mi (16.68 km) · 40.2 min end to end
Stop on this lineEnd of the lineTransfer, different platform
69th Street Transit Center → Frankford Transit Center
27 stations · 13.16 mi (21.17 km) · 41 min end to end
Stop on this lineEnd of the lineTransfer, different platform
69th Street Transit Center → Norristown Transit Center
22 stations · 13.4 mi (21.56 km) · 29 min end to end
11th Street is on the route data and off the map
One gap in the middle of the L, and the reason the station count depends on who you ask.
Between 13th Street and 8th-Market on the L there used to be a station, and the route data still names it in both directions. It is not on this map, because no train stops there: the stop list the drawing is built from no longer contains it, and not one trip in the whole schedule calls at it.
That single closed platform is the reason three different sources disagree about how many stations the L has. It is worth a page of its own, and it has one: 11th Street, the closed station.
Stations that look next to each other and are not
Close on the street, unconnected in the network. Measured between the station coordinates.
| One station | The other | Apart |
|---|---|---|
| 13th Street L | Walnut-Locust B | 452 m |
| 13th Street L | Race-Vine B | 558 m |
| 5th Street/Independence Hall L | Chinatown B | 593 m |
A schematic map puts stations where the grid has room, not where they are. These three pairs sit a few hundred metres apart on the street and belong to different lines with no connection between them: there is no passage, no shared ticket hall and nothing in the data that treats them as one station. If you get off at one expecting the other, you are walking.
The real changes between lines are the three marked in gold on the diagrams above, and nowhere else.
What this drawing claims, and what it does not
A map that says what it is for is more useful than one that pretends to be a street plan.
It is schematic. North is up, the lines are drawn on an octolinear grid and the distances are not to scale: a long run between two outer stations takes the same space as two stops in the centre. What the drawing is good for is order and connections — which station comes next, which line you are on, where you can change. What it is not good for is judging distance or deciding to walk.
It does not show street geography, bus or streetcar routes, which entrance to use, or anything about how a station is built. It also does not show the regional rail network, which is a different mode.
It is drawn from the data, not traced. The stations, the order of every line and the line colours come straight out of the published schedule data; the geometry is ours, on our own grid. No official map artwork is reproduced here, and no operator logo or line emblem appears on it — the data may be redistributed, the trade marks may not.
Frequently asked questions about the map
Yes. The PDF above is vector: it stays sharp at any size and prints clean on A3. It is about 103 KB.
Yes, with credit. The drawing is ours and is published under CC BY 4.0; the schedule data underneath it belongs to the operator and may be redistributed under its open-data terms. The details are on sources and licences.
Because the operator’s open-data terms let us redistribute the data and expressly do not let us use the trade marks commercially. The official map, the logo and the line emblems are trade marks. So the data is used and the artwork is drawn from scratch.
Three, and all three are marked in gold on the diagrams above: 15th St/City Hall, 8th-Market and 69th Street Transit Center. In each one the two lines use different platforms, and the walking time between them is not published anywhere we can read.
It is drawn from the schedule data that was current when the site was last rebuilt, and that schedule runs to 20 February 2027. When the data is refreshed, the drawing is redrawn with it rather than patched.